MULTI-HAZARD CLIMATE INDICES · OPEN SCIENCE
Follow drought as it becomes fire, flood and energy stress.
Drought, wildfire, flood-potential and energy indices. We are working toward one shared calendar and one probability scale, so the cross-hazard figures are synthetic for now. Each value traces back to its source data, its method and its validation evidence.
Built on climate_indices, a BSD-3-Clause library forked from code that NIDIS and NOAA NCEI developed.
DROUGHT · SPEI · 9-MONTH
Standardized Precipitation Evapotranspiration Index, contiguous U.S., September 2026
Preview — Domain Review pending
September 2026preliminary
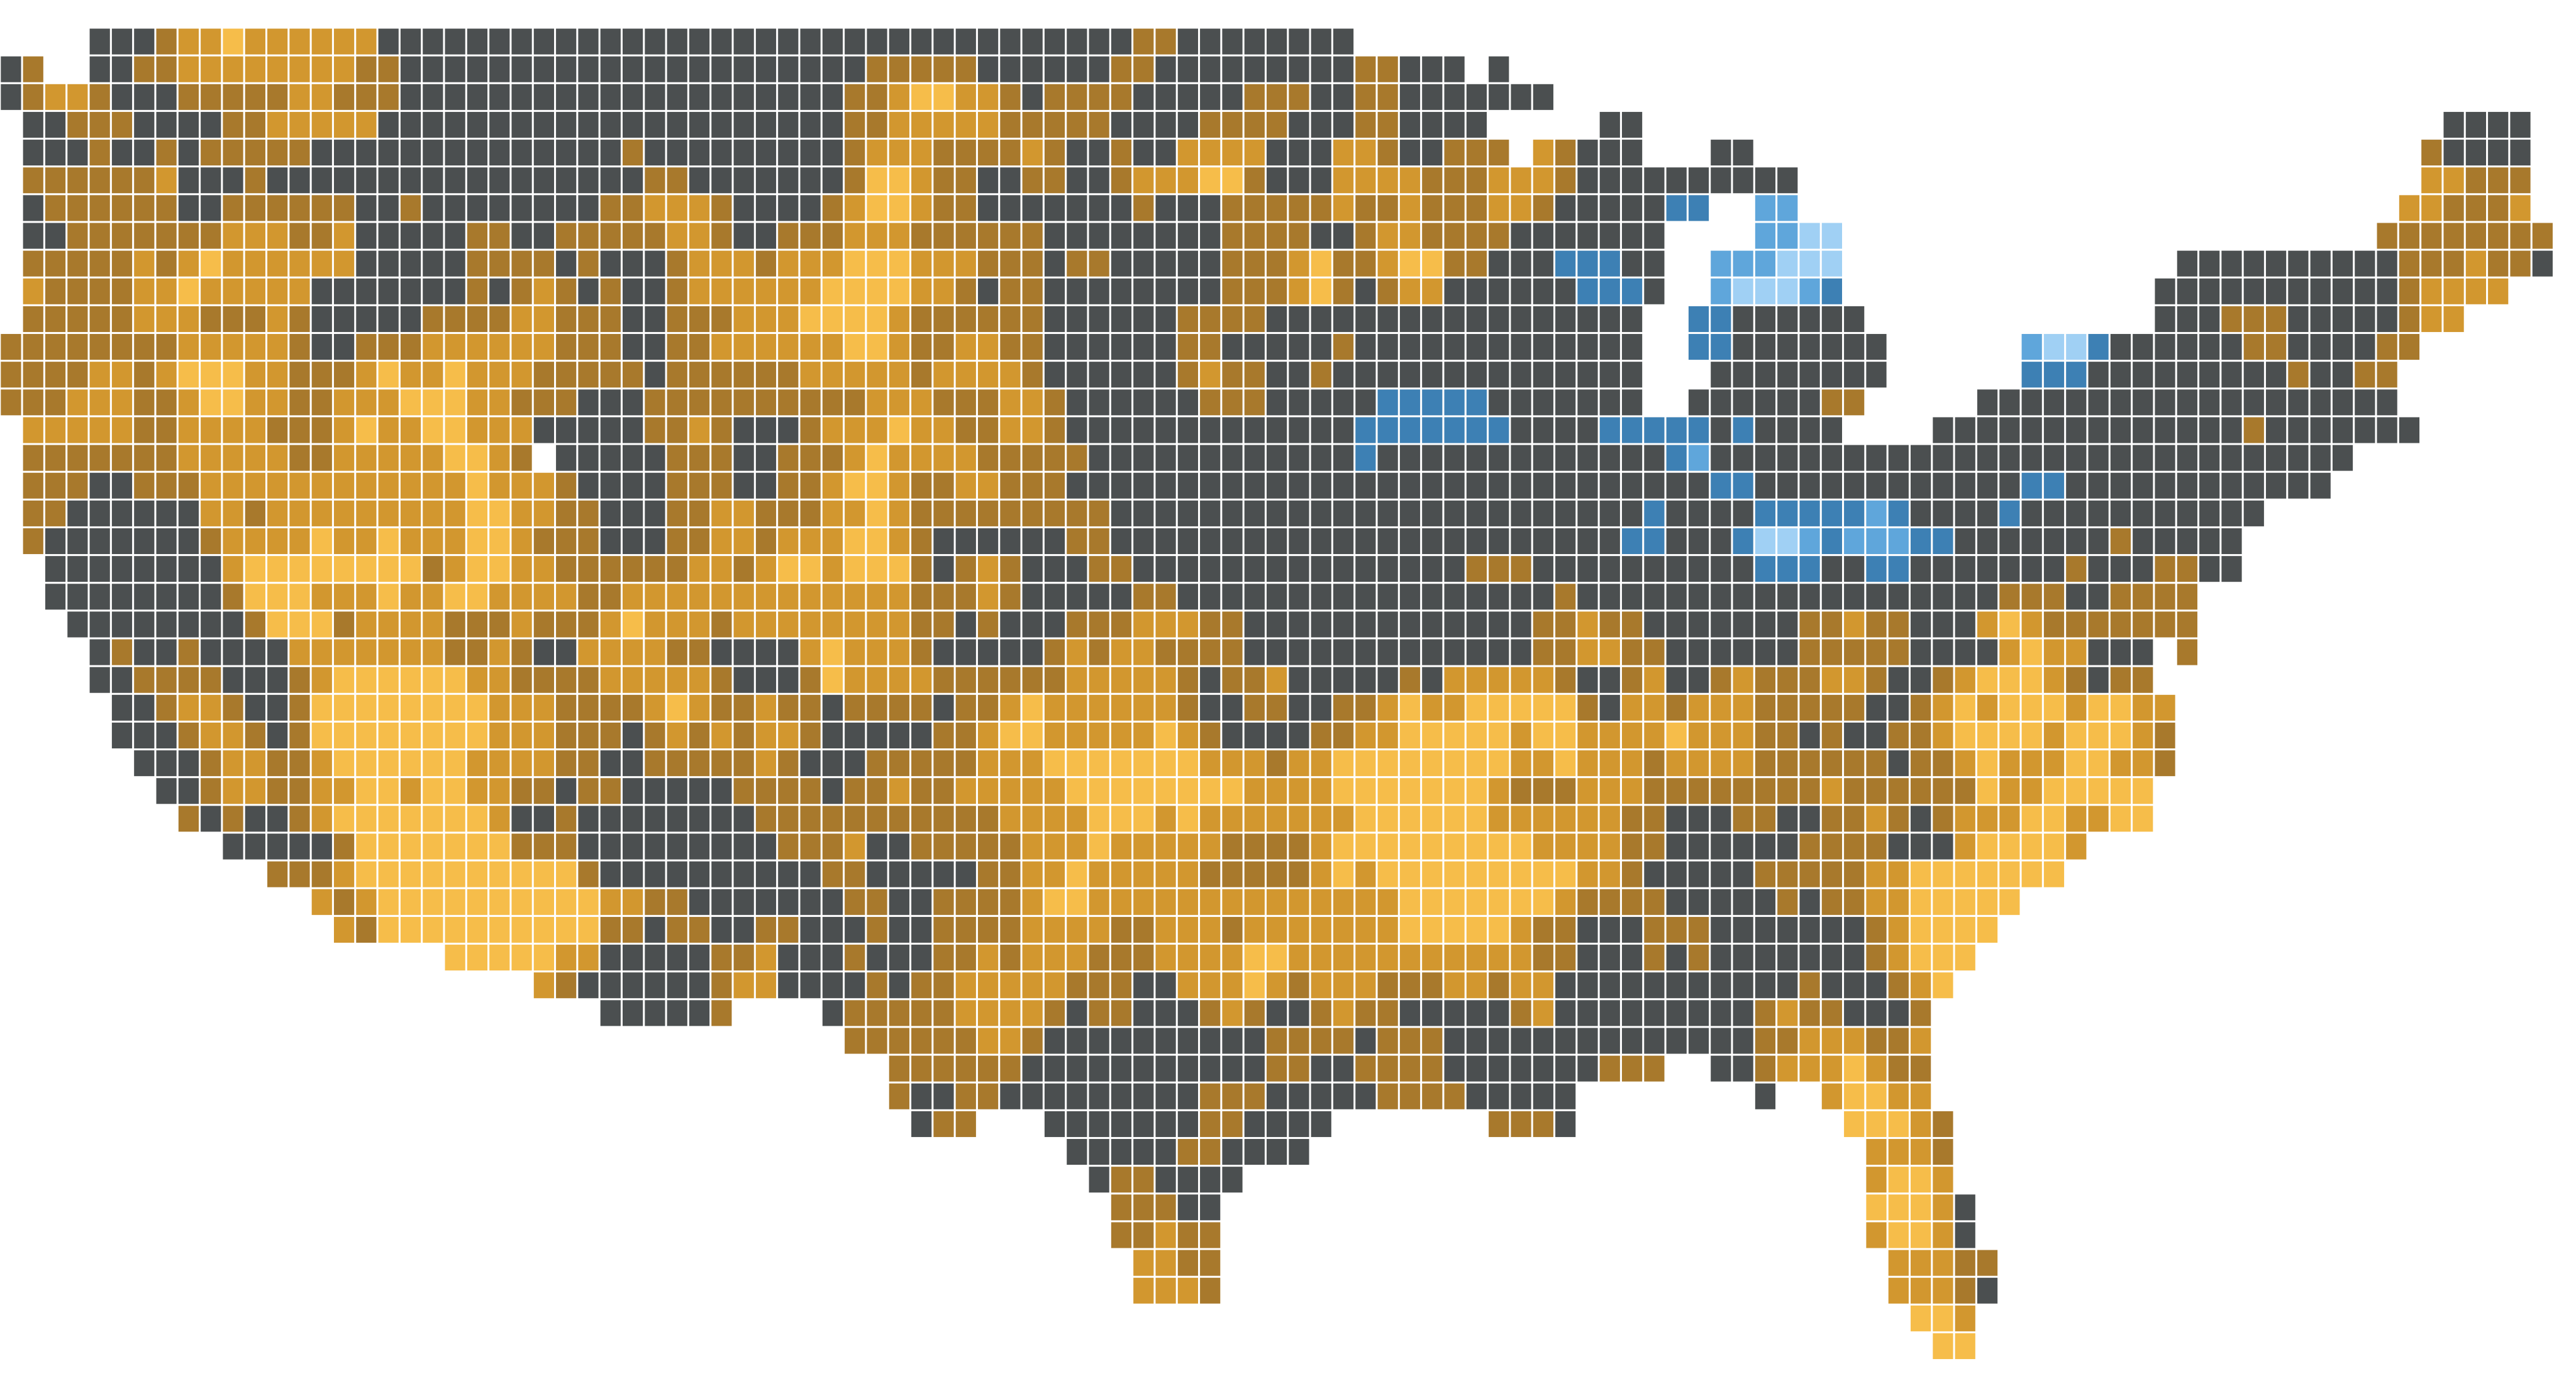
Until the interactive map has loaded, its controls stay off and the map shows the latest month.
Mapped area in drought (SPEI ≤ −1.0): 57%
Each cell is weighted by the cosine of its latitude. SPEI is computed from inputs averaged to 0.5° cells. September 2026 is a preliminary month, so NOAA may still revise it. Source: NOAA nClimGrid-Monthly. Modified data; not endorsed by NOAA.
data: nclimgrid-monthly · method: spei · log-logistic · thornthwaite · 9mo · calibration: 1991-2020 · engine: climate_indices 3.2.0 · evidence: implementation parityHazards connect. Drought is often where it starts.
Drought dries fuels, sets up the swing to flood potential when it breaks, and arrives with the heat that raises cooling demand. We start from drought and follow it outward, using one set of conventions for every hazard so the links can be measured.
THE HUB
Drought
SPI, SPEI (gamma, Pearson III, log-logistic), EDDI, the Palmer family (PDSI, PHDI, PMDI, Z-Index) and self-calibrated PDSI, with potential evapotranspiration by Thornthwaite, Hargreaves or FAO-56 Penman–Monteith.
- ILLUSTRATIVE
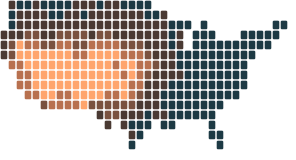 FWI percentilelowhigh
DROUGHT →
Fire weather
Dry fuels raise fire danger long before ignition. Tracked with KBDI, the Canadian Fire Weather Index system, Fosberg FFWI, Hot-Dry-Windy and Haines.
- ILLUSTRATIVE
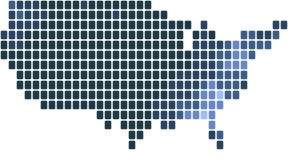 API percentilelowhigh
DROUGHT →
Flood potential
Droughts often end abruptly. Effective precipitation, the Effective Drought Index, the Flood Index and the Antecedent Precipitation Index track how fast flood potential returns. Potential, not observed flooding.
- ILLUSTRATIVE
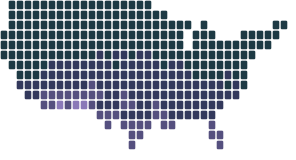 Cooling degree days percentilelowhigh
DROUGHT →
Energy stress
Hot, dry seasons raise cooling demand. Heating and cooling degree days, hub-height wind speed, wind and solar capacity factors, and standardized production, demand and residual-load indices.
Illustrative, synthetic values, not observations.
Drought month by month, and the hazards beside it.
With the interactive map loaded, selecting a cell on it shows that cell's real SPEI and SPI here, month by month. Fire weather, flood potential and energy stress have no published data yet, so the cascade below it is an invented place, synthetic for every hazard.
An invented place over five years
Illustrative, synthetic values, not observations.
- In this illustration, a drought builds over months. A short time scale shows it first, and a long one shows it later and holds it longer.
- In this illustration, fire-weather danger rises in the warm seasons inside the drought, as fuels dry.
- In this illustration, the drought ends abruptly, and flood potential returns soon after it breaks.
The evidence, stated plainly.
The four hazard families are not equally mature, and we say so. The library keeps a validation record for each index. The Registry reads it as one Evidence Kind per specification, at its weakest link, once a named reviewer has approved the reading. Where none is approved, we say that instead.
| Hazard | Registry reading | What it rests on |
|---|---|---|
| Drought | Regression covered to implementation parity | The Scenario Lab's nine SPI and SPEI members, from SPI at regression covered to SPEI log-logistic at implementation parity. The library also compares EDDI with NOAA PSL reference series at one location, standard Palmer with NOAA nClimDiv for all 344 climate divisions (qualified), and SPI with NOAA NCEI climate-division SPI (Pearson III only). |
| Fire weather | Not yet reviewed | The Canadian FWI system matches the Natural Resources Canada reference implementation on one calibration sample. KBDI reproduces the Keetch and Byram (1968) worked example and is not independently validated. Hot-Dry-Windy reproduces one published case. Fosberg and Haines have no validation row yet. |
| Flood potential | Not yet reviewed | Tested against the published method definitions only. No external reference dataset has been adopted. |
| Energy stress | Experimental to implementation parity | Cooling degree days reproduce NOAA CPC's published example, and heating and energy degree days are specification-level. Hub-height wind speed matches two independent implementations on synthetic inputs. No product-level external reference has been adopted. |
Full record: VALIDATION.md in climate_indices
Questions we are working on.
- Available now
How sensitive is a drought call to method?
Change distribution, calibration period and time scale for SPI and SPEI in the Scenario Lab, then export the exact recipe. One stored basin today: Apalachicola–Chattahoochee–Flint.
- In development
When does drought hand off to fire weather?
Joint exceedance and lagged conditional probability on one percentile scale, with significance tests that respect persistence in the record.
- In development
How do droughts end in flood potential?
Drought-to-flood transitions as linked events from run theory: onset, duration, peak, and the gap between one hazard ending and the next beginning.
- Exploring
Where do the indicators agree?
Side-by-side agreement across indices and time scales for a region and season, in the percentile terms drought assessments already use.
Commitments that don’t change.
- 01
climate_indices stays permissively open (BSD-3-Clause) and never requires Earthflux to compute.
- 02
Every number we publish can be reproduced from climate_indices, public data and its recipe.
- 03
Provenance and validation conventions are published as open specifications.
- 04
Software releases and key derived datasets get DOIs and citation workflows.
- 05
Uncertainty and validation status are shown, never collapsed into one confidence badge.
BUILT ON
Forked from code that NIDIS and NOAA NCEI developed. On GitHub since 2017 under BSD-3-Clause, and now covering drought, fire weather, flood potential and energy.
Public data
NOAA nClimGrid-Monthly for the Scenario Lab and the hero map, gridMET for the Lab's Hargreaves and Penman–Monteith members, and your own data through the library.
Review the science with us.
We are looking for drought, fire-weather, hydrology and energy-meteorology scientists to review methods and evidence, and for research and agency partners to shape what comes next.